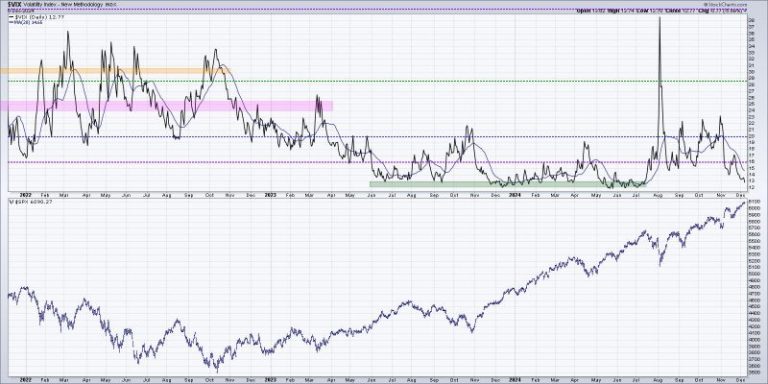
“The market goes up the escalator and down the elevator.” This is a quote that one of my mentors, Ralph Acampora, shared with me when I visited him years ago at his farm in Minnesota. This market truism is based on the fact that volatility tends to remain low in bull market…
The first trading week in December started on a positive note, with the S&P 500 ($SPX) and Nasdaq Composite…
As part of your daily trading routine, you likely start the day by checking the news and stock prices…
The broader stock market indexes sold off slightly ahead of the November Non-Farm Payrolls data, which will be released…
In this exclusive StockCharts video, Joe uses long-term views of the S&P 500 to explain how the market is…
In this video from StockCharts TV, Julius takes a deep dive into US sector rotation, breaking it down into…
When going through your morning trading routine, you’re likely to tune into the news for unfolding events, run technical…
In this video from StockCharts TV, Julius takes a deep dive into US sector rotation, breaking it down into…

